
Almost all data storage solutions have some sort of compression capability. It’s being told as a killer feature from time to time, reducing storage costs substantially, even moving some projects into feasible realms. In our experience though, the data was always compressed beforehand. Because, compressing was and is always the obvious first step, not only before storing the data, but also before moving it around, sending it to the first client, etc. It’s the first application of information theory for a reason.
A solid example is the video. They take up absurd amounts of space in raw formats. That’s why almost all cameras are equipped with encoder components, compressing the data into manageable formats, before sending them to the watchers. Most devices are even incapable of sending raw videos because the connectivity cost would make them expensive beyond reason. And that’s also why it doesn’t make sense to zip video files: They’re already compressed to their practical limits.
Another example is big data applications, where source data vary on a few dimensions only, while staying mostly the same in others. That’s why most data formats incorporate some sort of compression by default. They also improve IO performance significantly.
In both examples, and also as a general rule, compressing data according to its general structure is always a better option. When you know that this frame in this video isn’t going to be much different from the last one, you can factor that into your coding. On the other hand, trying to compress anything using a generic algorithm won’t be that efficient. That’s the bitter part.
Still,…
It’s not fair to expect all applications to be as efficient. Some have to store and access active and uncompressed data. And most use free-format user data, which might have lots of zeros to eliminate, or totally encrypted with nothing to reduce in a sensible way. For these cases, it may still be beneficial to compress data in the storage, even when we not it’s not as efficient as encoding video. The keyword is “may”. Meaning it depends, largely on the nature of the data being stored.
On the other hand, whether the ratio of compression is high or low, it always comes with a processing cost. Which is paid by CPU time, unless you have an exotic accelerator. Which in turn may affect your IO performance, even if you have that extra time. Yet, it might sometimes still be OK to get a hit on performance, if it really helps the bottom line.
Anyways, we tried to measure that using some synthetic workloads and the next part of this post will be about them. But first, how does compression work in ceph, or Wise Cluster since we based it on ceph? There are two (actually three but ms compression is out of scope) places where we can have compression in ceph:
- Object gateway (RGW): Server-side compression of uploaded objects.
- Bluestore: Inline compression of data blocks just before writing to disk.
Since RGW is a ceph client application storing data in rados, we can say that the first one is similar to our previous examples of data clients compressing their data themselves. For example,
- We have a 10MB file
- We send it to RGW using S3 API
- RGW compresses into into 1MB
- Stores it in ceph
From a practical perspective though, since object gateways are generally used by other client applications, the common use case is to compress the data before sending it to gateway:
- We have a 10MB file
- We compress it to have 1MB gz file
- We send it to RGW using S3 API
- RGW stores it to ceph directly
But maybe that’s common because AWS S3 still doesn’t support server-side compression. That’s another bitter part. Maybe you’d prefer your object storage to compress your data for you. Maybe you’d want your big data jobs to store uncompressed results but your object storage to compress them on-the-fly when you want to download them. And that would be the sweet part of Wise Cluster. 🍬 It’s for another post, though.
The second place to compress data is the OSD process handling IO to and from the physical drive. This means that it’s structure-agnostic and won’t know how to compress efficiently. It will run a standard algorithm (snappy, zlib or zstd) over a block of data, and if the result is smaller than a percentage of the original, it will store that. If not - or in other words if the data is not a good candidate for compression, because it’s already compressed or encrypted or something like that; it will store the original. So that you won’t need to decompress while reading it. But it will still bill you for trying.
In our tests, we used the popular benchmark tool fio to generate data while measuring the performance. We have our numbers stored, differences calculated and bar graphs ready. Just as the ones you can find on google. But I doubt that they can satisfy you more than the stuff you’ve already read. Because the result is always the same: it depends. Or in other words you’d need to run your workload with your data and see if compression really works for you.
If you already know that your data compresses well and wonder how that’s going to cost you if you do it on Wise Cluster, here’s an idea though: One of our tests was on a deployment running with very-low-end servers. We don’t normally offer these types of machines for any kind of workload (not-yet anyways). Since the CPUs are pretty weak we thought that if the compression is ever going to be a problem it should be on those. We ran the test for 15 minutes with no compression and then with compression. Mainly because we like seeing charts sitting on a time scale instead of an imaginary baseline. 15 minutes, so that we can fit both tests in a tight dashboard:
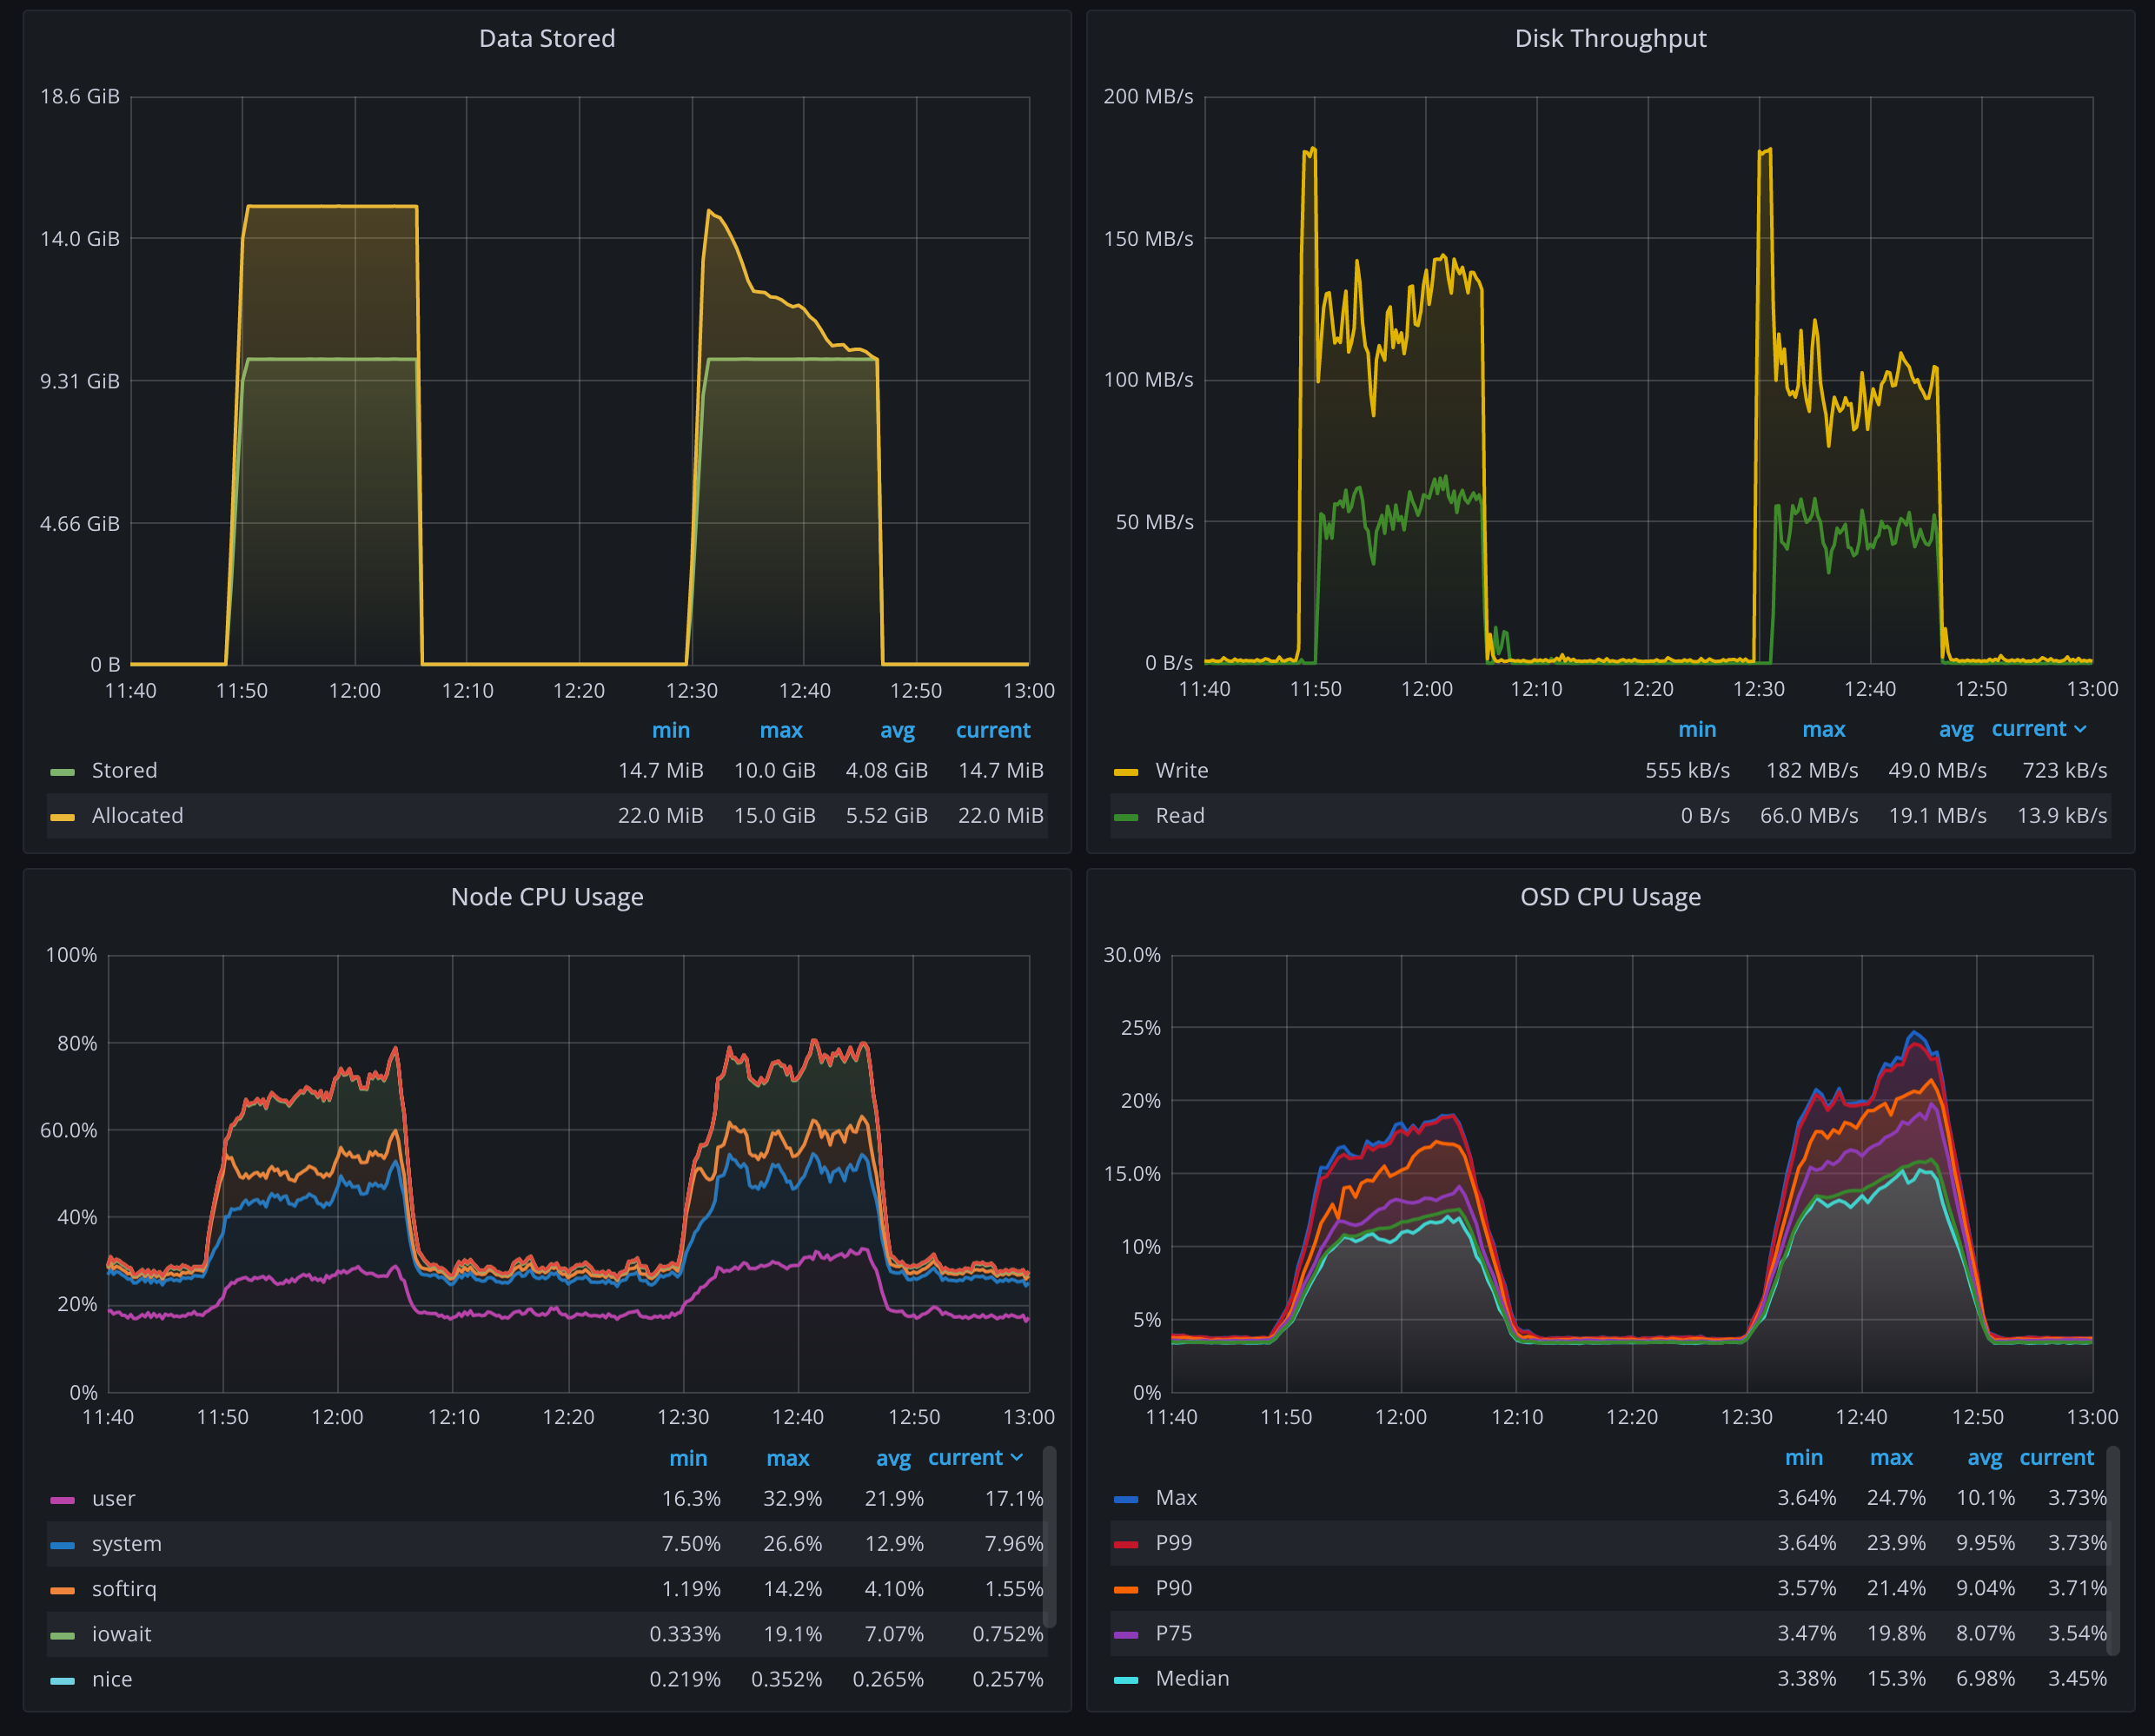
Let’s start reading with the upper-left one. This shows the amount of data we stored with the amount it allocated from the cluster. The left bump in this graph shows us storing 10 GB data, and it taking up 15 GB of space. That’s exactly what we expect because we use 4+2 erasure coding.
Next test is when we enable bluestore inline compression on force mode. The yellow line starts again with a 15 GB of space being allocated but as the test progresses it drops down to 10 GB. This is a solid example of the “it depends” phenomenon. As you can see, the amount of data stored is 10 GB across the test. But it can take up different amounts of space, up to the maximum uncompressed 15 GB, down to the 10 GB and anything in between. That 10 GB is coincidental but it also means we can reliably store the data without any overhead!
In the upper-right graph, we see the amount of data being written to and read from the storage devices, and how it’s reduced in the compressed case just as we expected.
Lower graphs try to show the CPU time we pay by compressing. The left one is for all nodes all cores and it’s not that easy to see the change, even in these extremely low-spec nodes (hint: it’s virtually insignificant in nodes with standard specs). Right graph tries to show the effect by isolating the CPU usage of OSD processes only. This time it is obvious that OSD processes are working a bit harder, but they’re nowhere near exhausted.
This is all good but how does this all look from the client’s perspective? How does inline compression affect the IO performance? The shortest answer: not much. A bit longer: expect ~5% drop in small sized IO, expect similar increase in read latencies.
Full numbers for IOPS, it that’s your thing:
| IOPS | IO Size | No Compression | Force Compression | Difference |
|---|---|---|---|---|
| Read | 16k | 245 | 229 | -6,53% |
| Read | 64k | 179 | 172 | -3,91% |
| Read | 256k | 150 | 148 | -1,33% |
| Write | 16k | 246 | 230 | -6,50% |
| Write | 64k | 179 | 171 | -4,47% |
| Write | 256k | 151 | 149 | -1,32% |
And 99th percentile for latency, if you’re after that:
| Latency 99p | IO Size | No Compression | Force Compression | Difference |
|---|---|---|---|---|
| Read | 16k | 204 | 210 | 2,94% |
| Read | 64k | 236 | 249 | 5,51% |
| Read | 256k | 174 | 184 | 5,75% |
| Write | 16k | 228 | 234 | 2,63% |
| Write | 64k | 279 | 279 | 0,00% |
| Write | 256k | 249 | 255 | 2,41% |
And check the full fio reports for no-compression and force-compression if you’re into the details.
Finally the sweet part. As I have said earlier, this is a very-low-spec cluster just to see the effects of compression on CPU usage, and on client performance. But even for that setup, it seems like a great tradeoff! 5% drop in performance is nothing compared to - a possible - 33% reduction in required capacity. Consider that this cluster would never be deployed for its performance in the first place, but for its capacity efficiency. It’d probably be multi-petabytes, housing hundreds of HDDs, if not thousands. And even a 10% reduction would change the bottom line significantly, since the HDD cost is the main driver in these environments.

