
Like any distributed system, reliability of ceph operations largely depends on the available monitoring. Over the years we have seen and deployed many solutions ranging from zabbix to opentsdb to others for the same purpose. Nowadays our general choice is around Prometheus and that goes for ceph monitoring as well.
And -not so- coincidentally ceph also somewhat endorses this setup by including Prometheus powered metric monitoring in its default dashboard. While ceph mgr also supports many other tools as alternatives, recent surveys also show strong Prometheus preference among the users.
This idea is based on the fact that the ceph mgr service already knows a lot about the current operational status of the entire cluster. Ceph services push their status and metrics to mgr so we can make them accessible to other systems. In the Prometheus case this would only require an http endpoint on mgr to expose this (and maybe even derived) data in the necessary format. Which is what the mgr module basically does. So what you have is similar to this.
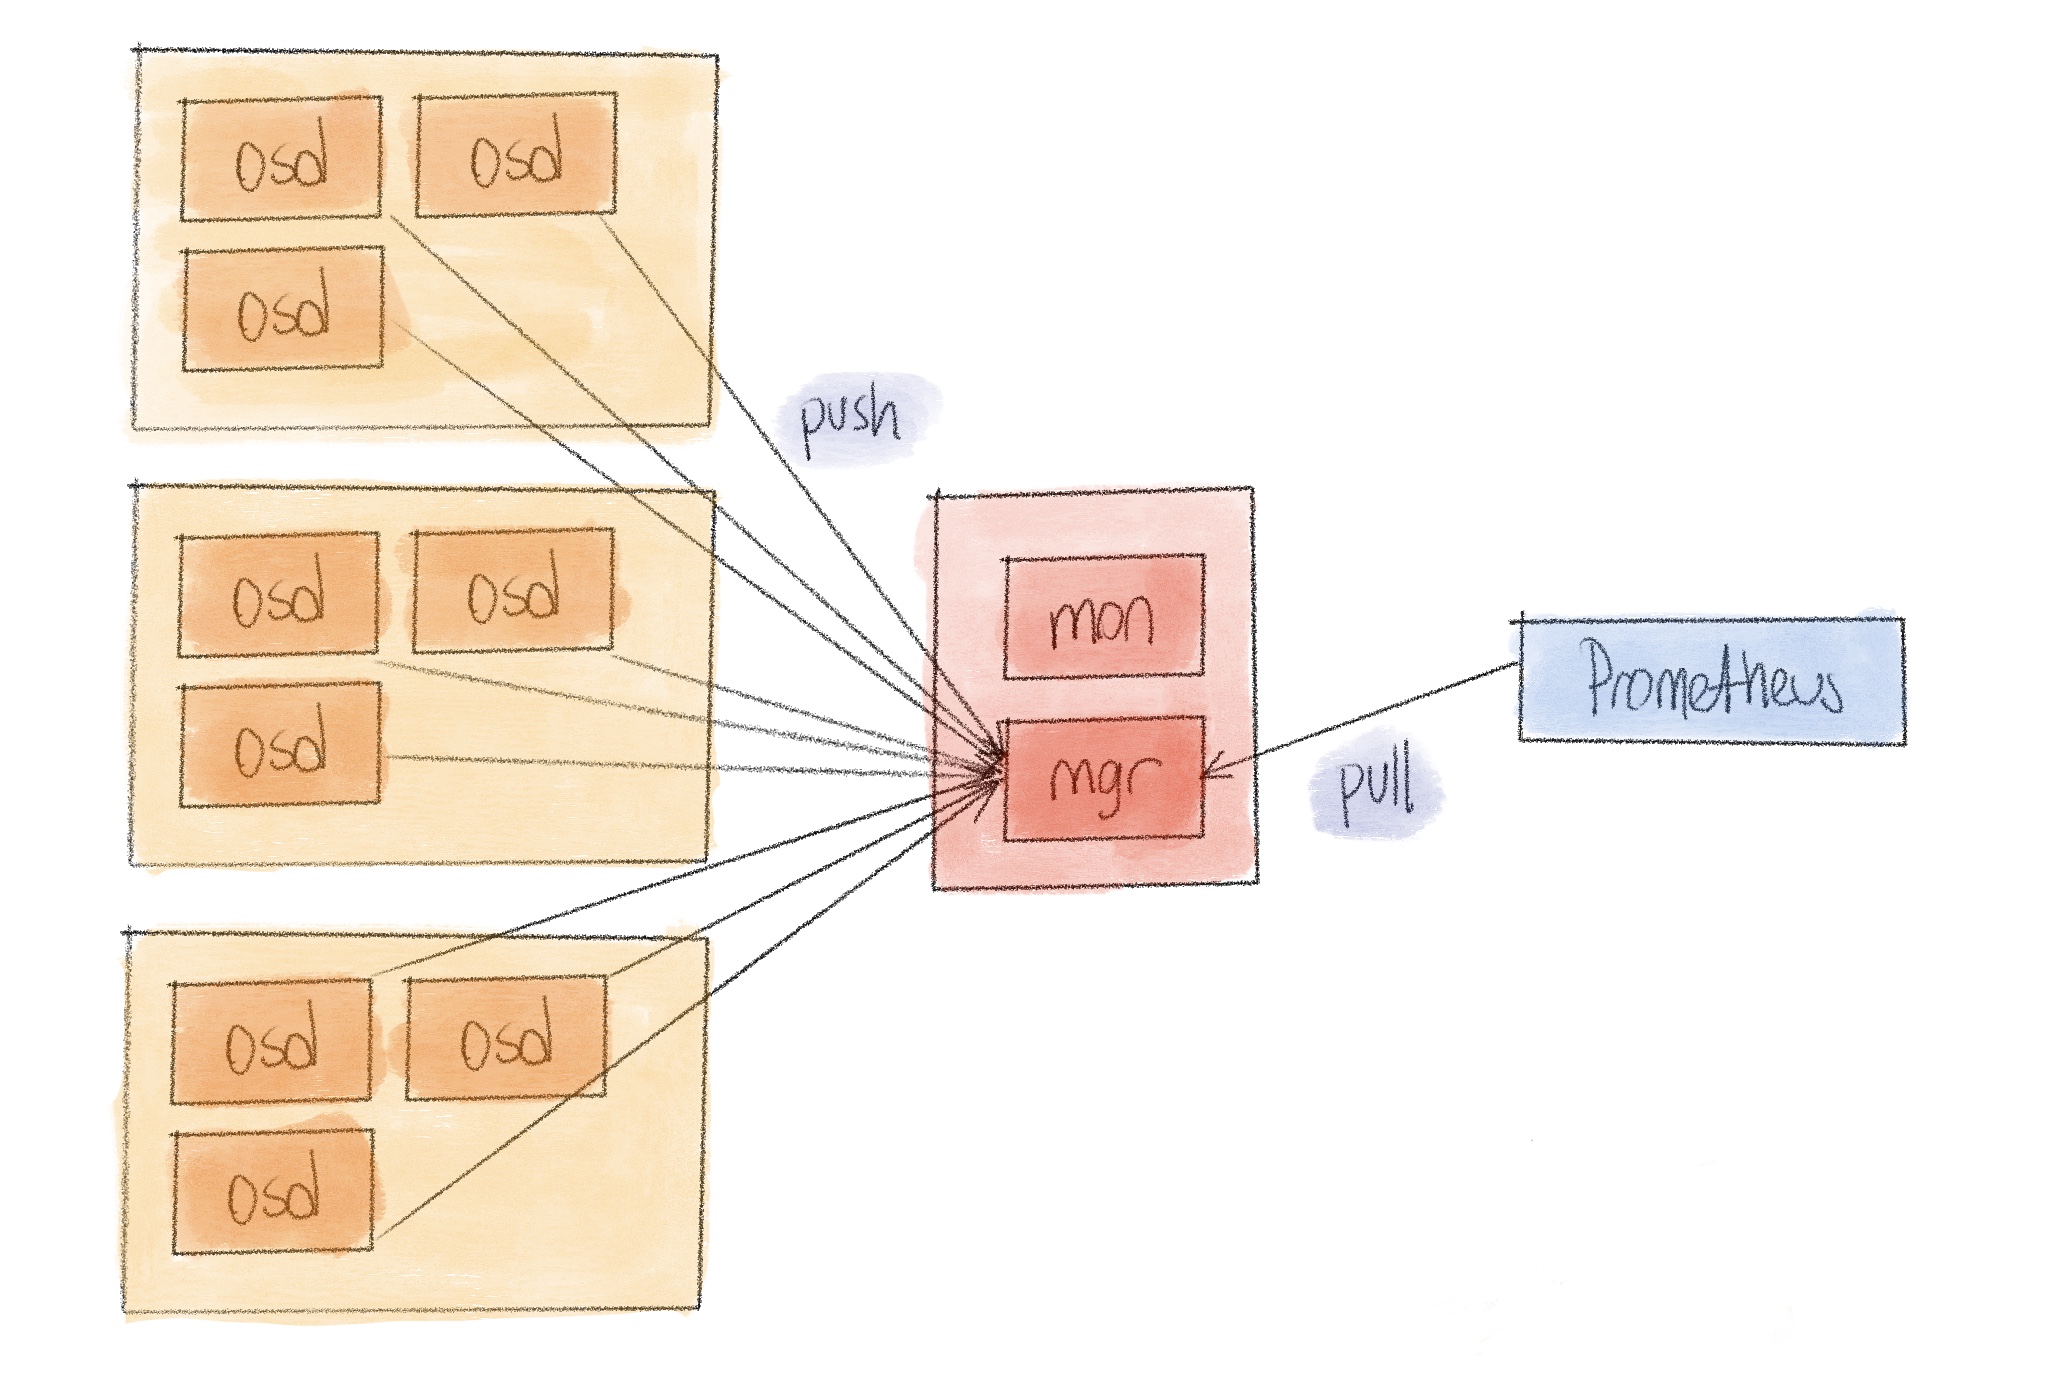
To this date, including the octopus release, Mgr service is still an active-standby system. Meaning for any given time there would be only one active mgr service. One mgr to receive all data, one mgr to aggregate them, one mgr to expose them all, and to Prometheus send them. This works blissfully when you have 3 mons, 7 osds and 9 clients but, as all single points in any distributed system, it will crack when the numbers increase. Especially the number of drives in the cluster since we’re interested in them the most.
For example a modest cluster with 600 osds generates about 6 MB of metric data for a single probe. This is generated at mgr side, and ingested by Prometheus every 30 seconds, depending on the scrape interval set at your Prometheus configuration. Not bad. But for a hypothetical cluster with 7000 drives this data becomes 60 MB and it becomes really problematic for mgr to just generate it, considering it will already be under a significant load trying to keep up with everything.
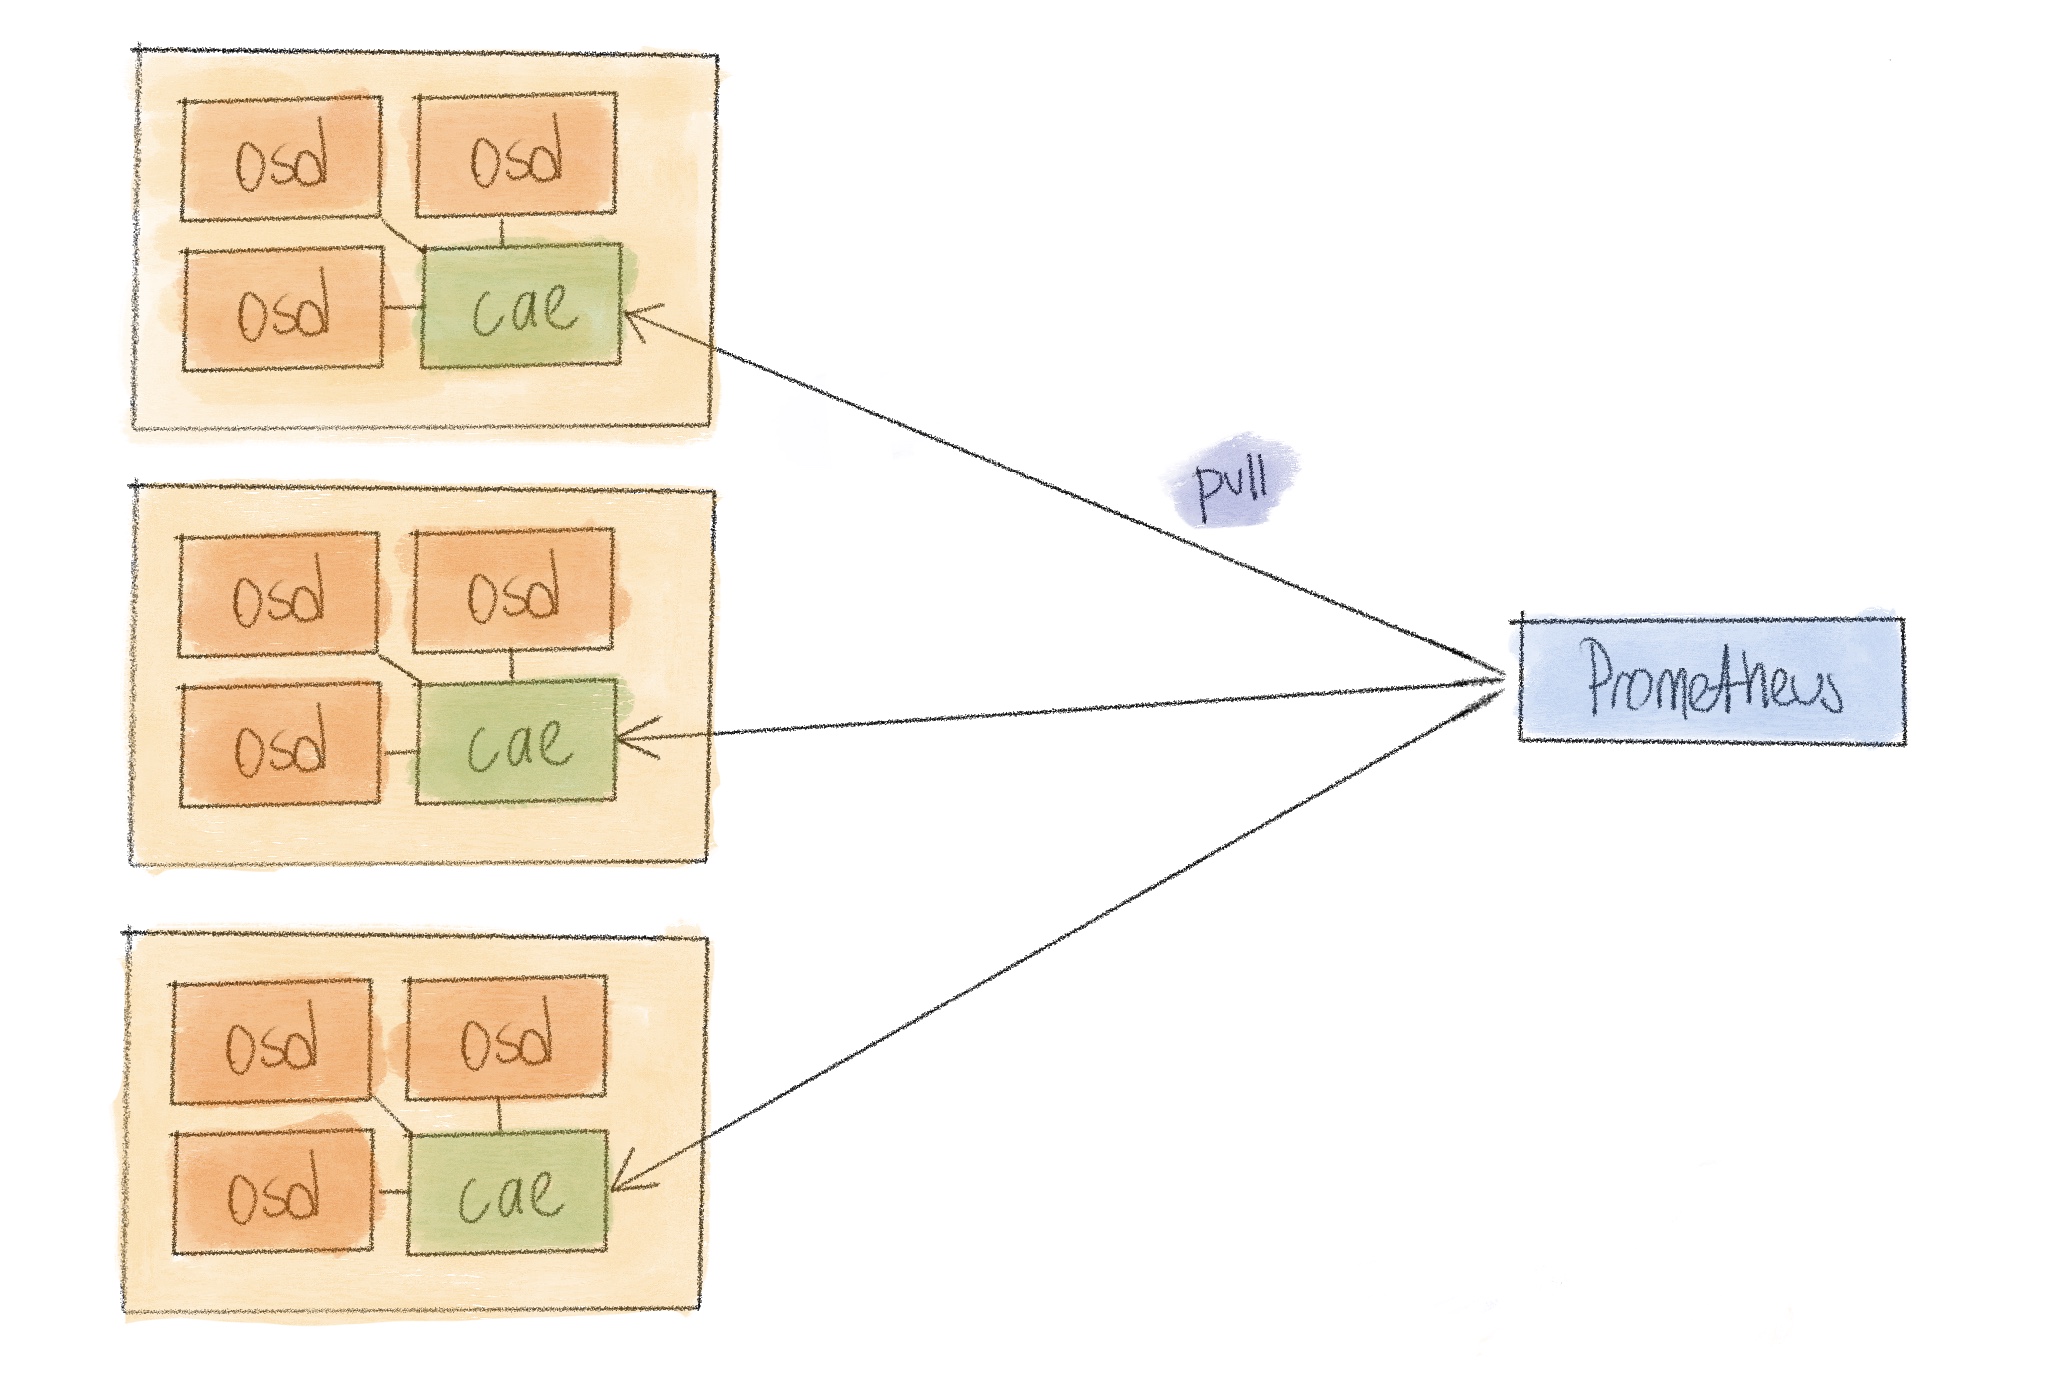
Since the data we’re after is in the osd service, we can get this data from them directly instead of collecting in a single place first. Prometheus is perfectly capable of scraping more than one target and in fact, that’s what everyone does for any multi instance application. On the other hand, it’s also the only thing we were able to do for earlier ceph releases before mgr and plugins. We had a collecting daemon on each of the nodes containing osd services and they were sending the data to a central monitoring server.
And that’s what
ceph-adm-exporter exactly is.
All ceph daemons, mons osds and even mgrs, create an admin socket for some low
level operations. And these sockets all respond to perf dump command with some
critical performance data. What the exporter does is read and convert them to
the appropriate format.
In theory we could run a ceph-adm-exporter for each one of the daemons but that
would be a bit wasteful. So we run one on each node, responsible for all the
daemons on it. It finds the admin sockets in a directory and exposes perf dump
outputs for each scrape. It also uses the perf schema command to learn about
the metric types so it should be compatible with all releases of ceph, changing
metrics automatically.

